MICROSOFT:
BEHIND THE DATA
A Picture-Perfect Lookbook for DIY Data Visualization
My Role:
Senior Designer • Concept development
Visual design & layout execution
Collaboration with content strategists
Accolades: 1st place for the Best Digital Cover at the Content Marketing Awards
POWER BI
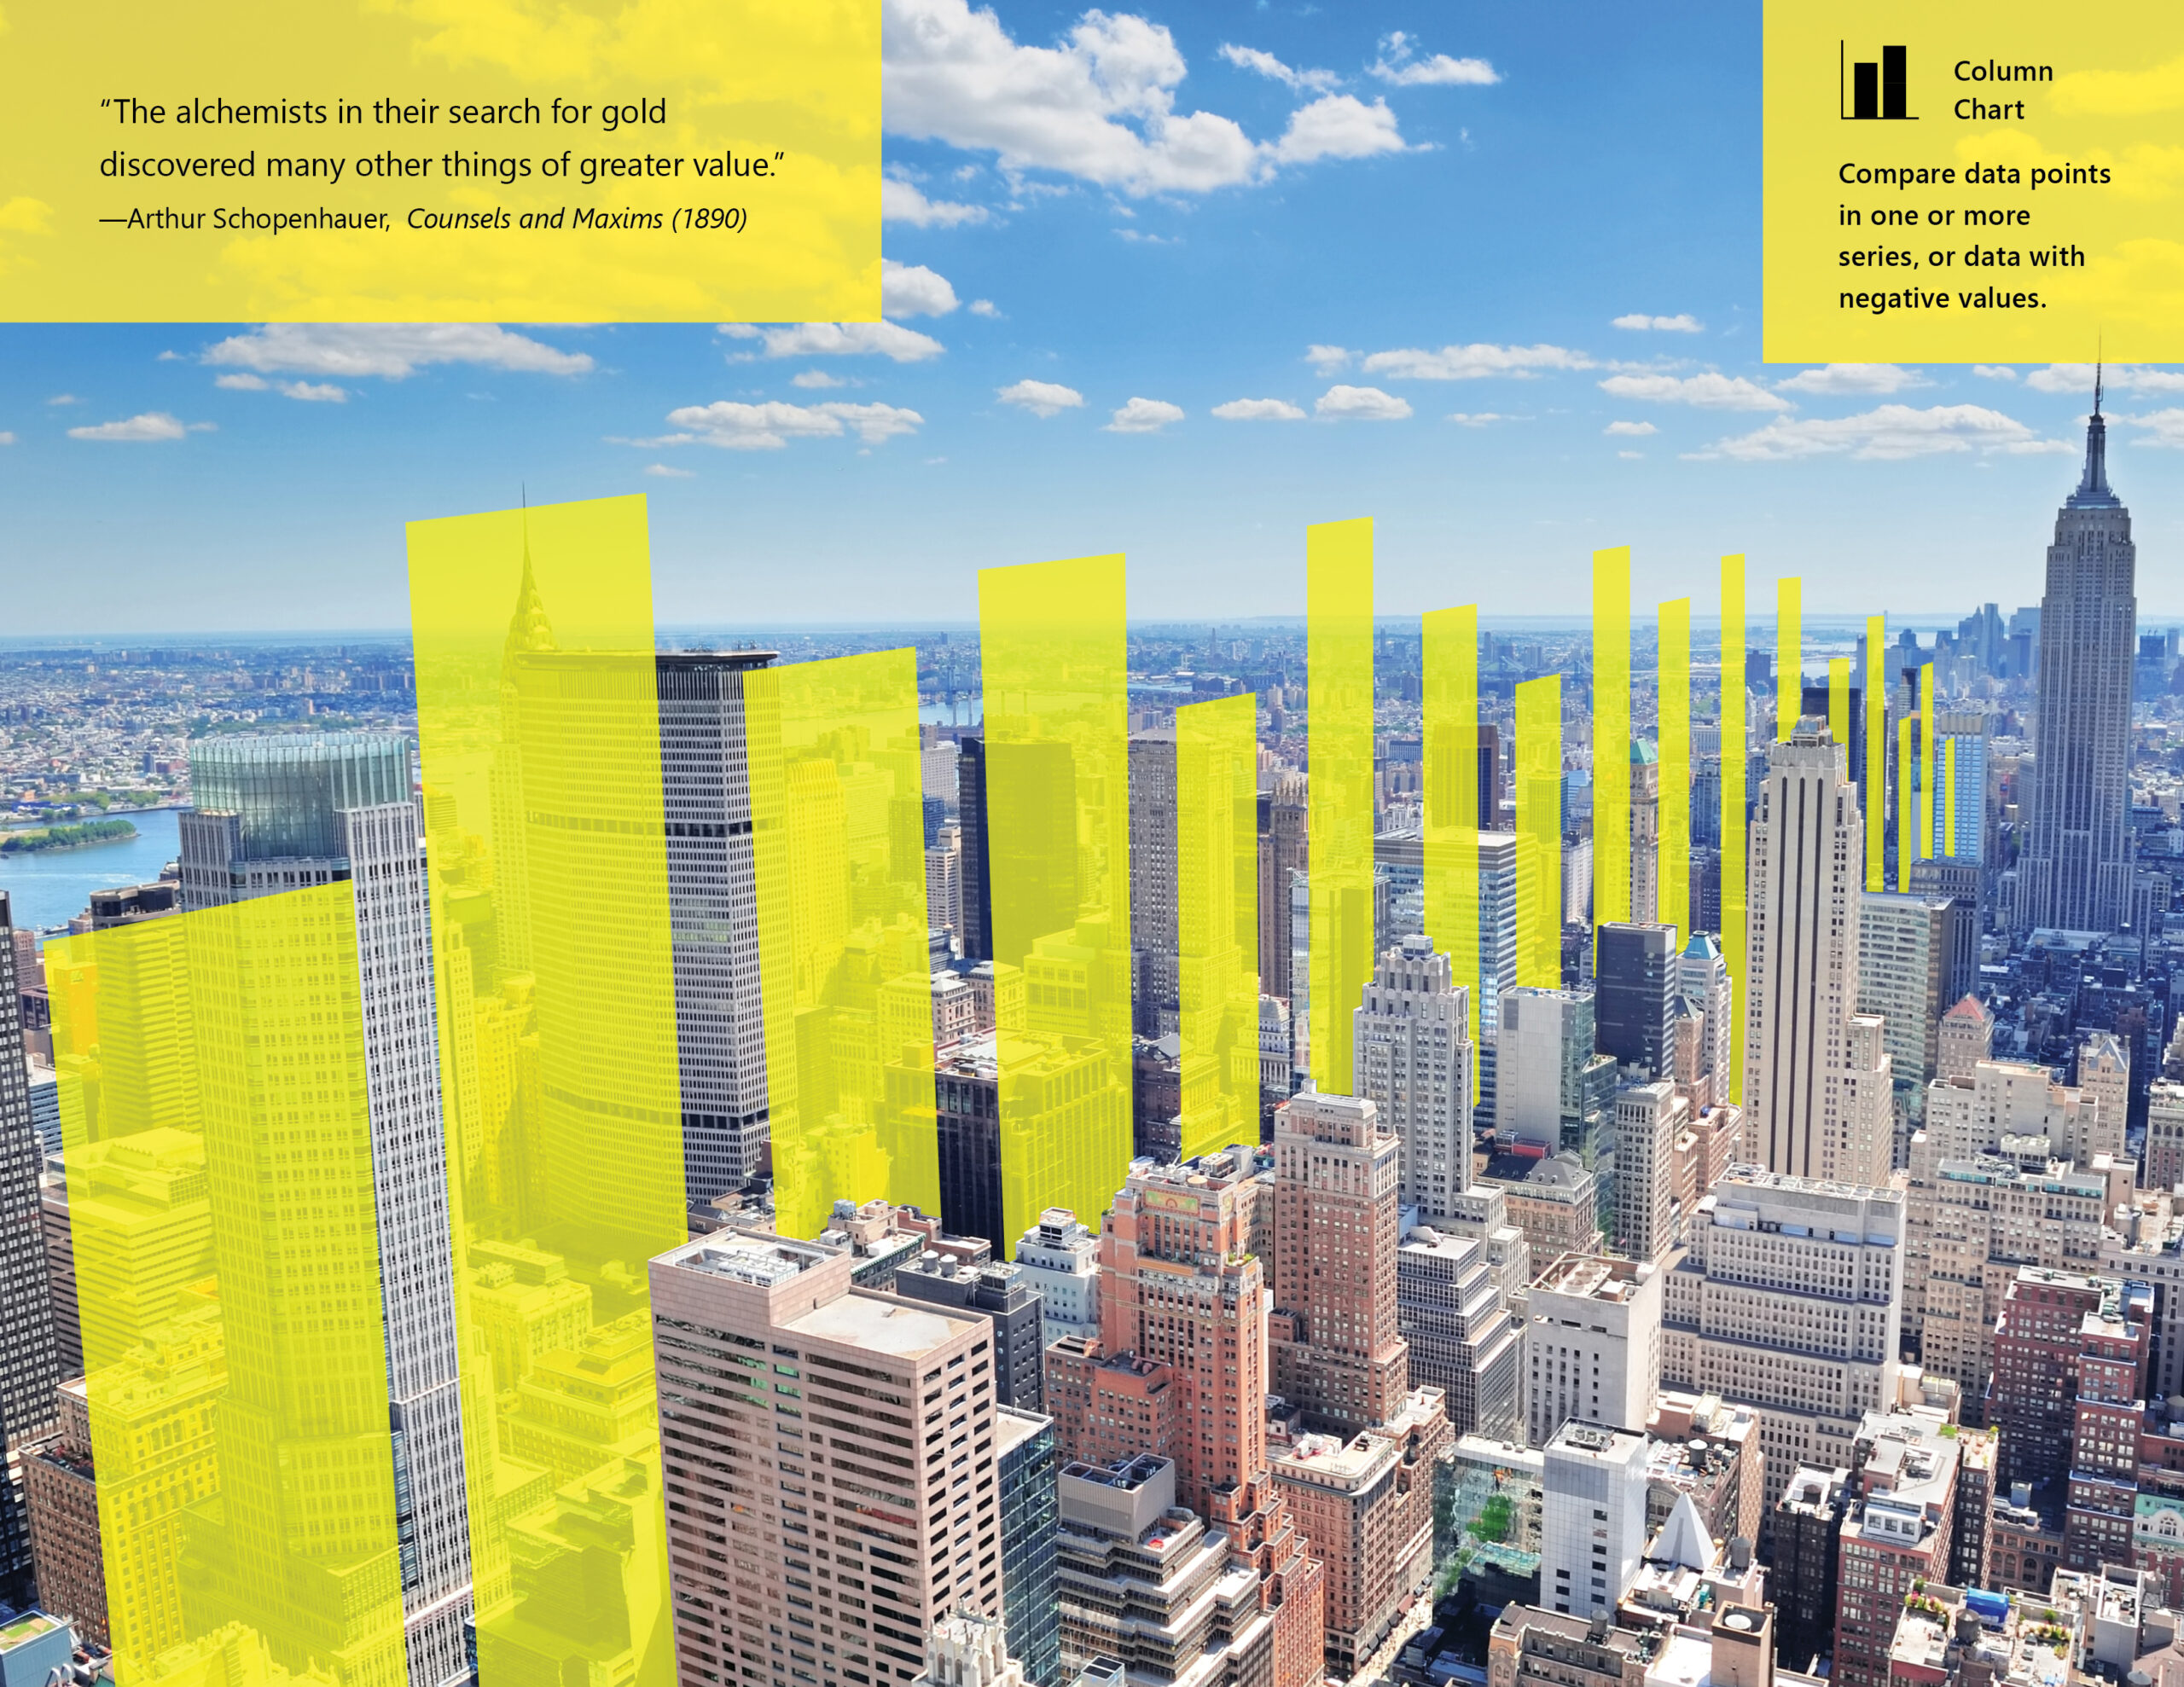
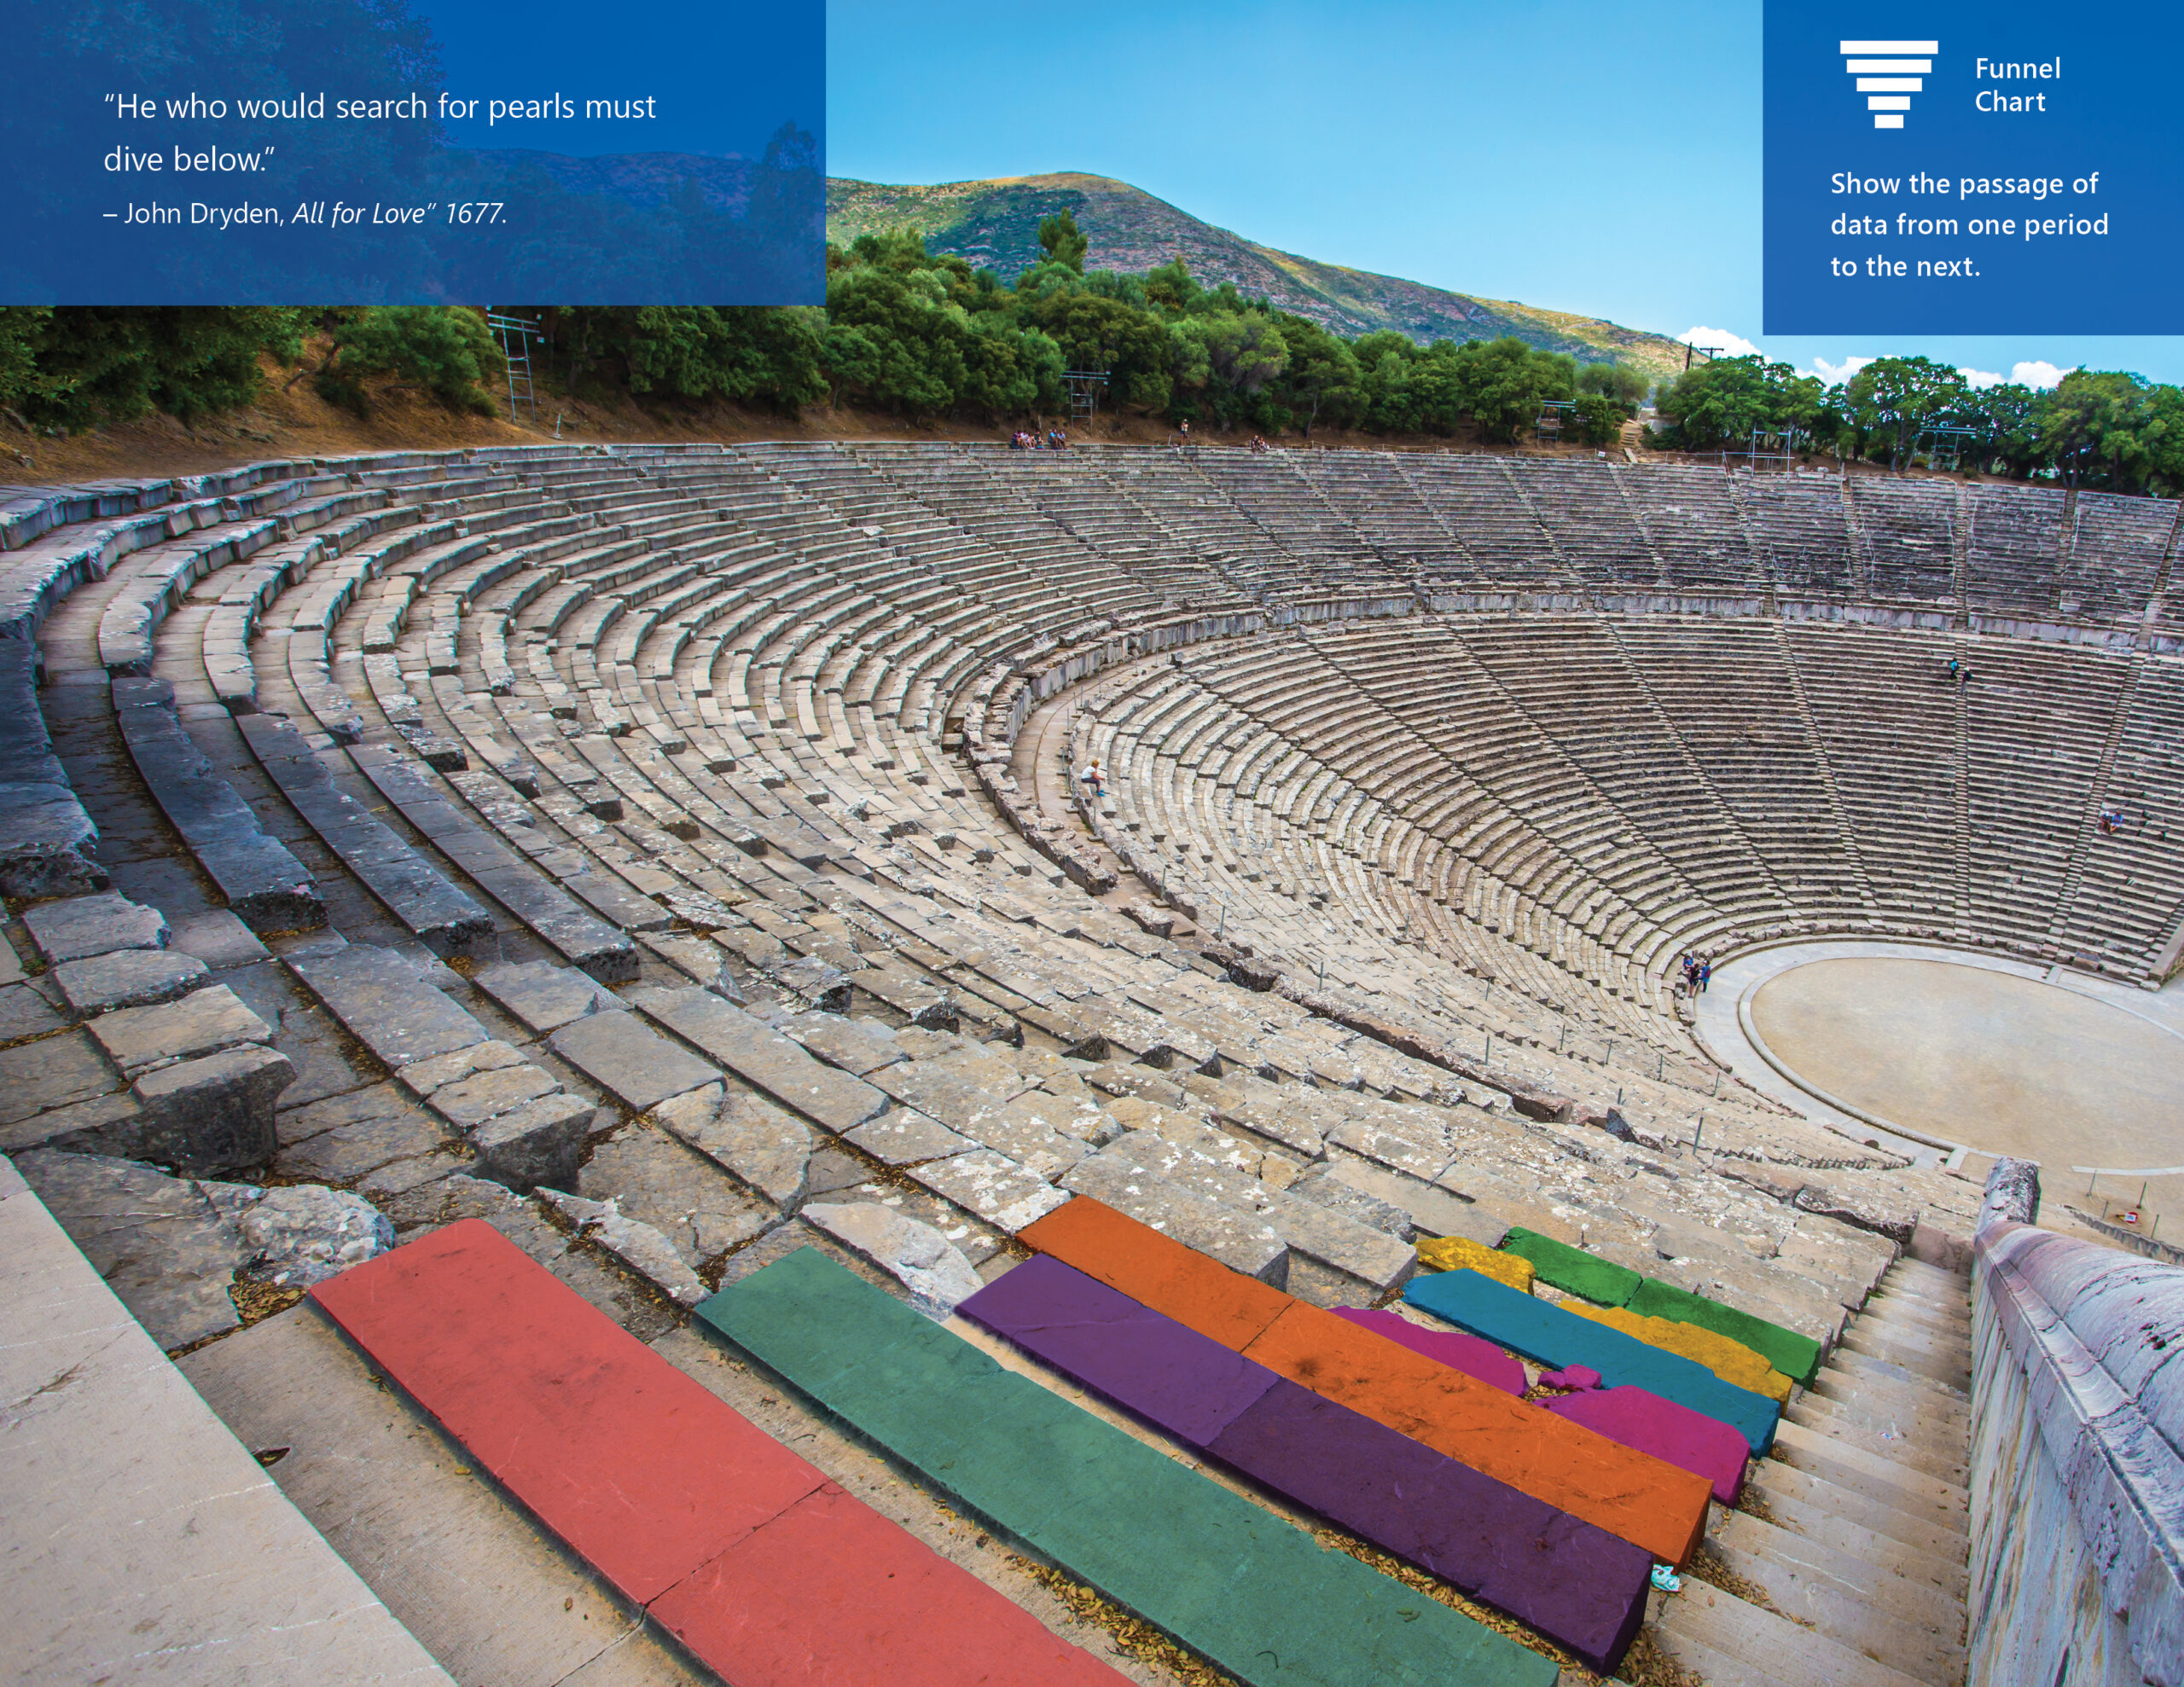
While I worked at Scorch Agency, I had the opportunity to design Behind the Data, a digital lookbook for Microsoft Power BI, aimed at reimagining data visualization through a creative and compelling visual approach. Rather than presenting data in a traditional, static format, I leveraged striking imagery, overlaid with chart-inspired graphics, to showcase how raw numbers and analytics could transform into meaningful, engaging stories.
The lookbook takes readers on a journey through different landscapes and urban environments, seamlessly integrating data visualization elements—such as line charts, bar graphs, and pie charts—into the real-world scenes. The goal was to make data more accessible, beautiful, and impactful, encouraging users to explore the artistic potential of analytics.